

Students who do research on LPU placement often look into numbers like the highest package, average salary, list of recruiters, as well as placement percentage. But there is a question that is worth asking: does LPU NIRF Ranking have anything to do with its placement performance? The answer is that there is a connection, but it is not a simple cause-and-effect relationship.
When you look at the Graduation Outcomes (GO) parameter of the NIRF ranking framework, this connection will become clearer to you. The outcomes from the placement form an important part of this parameter. This means that a university’s placement and other graduate outcomes can contribute to its NIRF performance. At the same time, the NIRF Ranking 2026 can serve as an external indication of the institution’s reputation and affect how future students and other stakeholders view the university. Nonetheless, one must not confuse the ranking with any sort of guarantee regarding placement results.
If you wish to understand this relationship, then you need to look beyond a single NIRF rank or the university’s highest-package figure. On our platform, NIRFRank, you will get the official ranking and graduation outcome data together in one place. This makes it easier for you to examine LPU’s performance across different editions of NIRF as well as look at indicators like graduates, students placed, placement rate, median salary, and so on.
For LPU, this ranking becomes quite interesting because changes in its NIRF position and changes in its placement outcomes do not always move in the same direction. So, when you look at the data across multiple years on our website, you will get a more meaningful picture rather than focusing only on the latest rank, highest package, or the number of recruiters.
In this guide, we will look at how LPU’s NIRF ranking connects with placements across B.Tech, CSE, MBA, BBA, and BCA. It draws a distinction between the placement information in NIRF and the placement data provided by LPU, and also considers what affects a particular student’s standing in the employment sector.
LPU NIRF Ranking 2025: Where Does The University Stand?
The latest results for LPU’s NIRF show that the university has a rank in several different categories. The ranking that is relevant to you depends on the program that you wish to consider.
NIRF Category | LPU Rank |
Overall | 49 |
University | 31 |
Engineering | 48 |
Management | 44 |
Pharmacy | 13 |
Architecture and Planning | 24 |
Law | 26 |
Agriculture and Allied Sectors | 17 |

Therefore, the data mentioned above tells us that LPU is at position 31 in the University category and 48 in the Engineering category. Its Management ranking is 44, and the strongest category result in 2025 was Pharmacy, where it ranked 13. These rankings should be interpreted according to the program being considered rather than treated as a single placement-related ranking for the university.
The Engineering ranking is the more relevant NIRF reference for a B.Tech student, while the Management ranking is more relevant for an MBA student. It is worth highlighting that there is no separate ‘placement ranking’ of LPU provided by NIRF. This is because the results related to placements are included in the Graduation Outcomes category, which is one of the parts of the ranking methodology. Therefore, when you search for the LPU placement, you should look at the underlying NIRF graduation outcome data alongside the headline ranking. NIRFRank’s LPU profile brings these published NIRF figures together. With this, you will be able to examine the placement-related data across different years.
How LPU Placements Contribute to NIRF Rankings?
In order to understand the connection between NIRF ranking and the LPU placements, you need to separate what NIRF measures from what the placement department reports. The NIRF ranking system will include the use of standardized data about institutions, whereas the university placement report will emphasize recruiters, offers, best packages, and other placement successes. Under the methodology for Engineering and Management, a 20% weight in the overall ranking framework is carried by the Graduation Outcomes. For Engineering, this parameter includes placement and higher studies, university examination performance, median salary, as well as Ph.D graduation. Similarly, the Management framework includes placement and higher studies, university examination performance, and median salary.
This creates an important relationship: placement-related outcomes contribute to the Graduation Outcomes component of the relevant NIRF ranking methodology and can therefore affect an institution’s overall ranking performance.
However, the reverse of this relationship- that a better NIRF rank guarantees better placements – should not be treated as a well-established one-to-one cause-and-effect linkage. We have mentioned a better way to understand this below.
Placement outcomes → contribute to NIRF's Graduation Outcomes score.
NIRF ranking → provides an external signal about institutional performance.
Institutional reputation and employer perception → can influence the recruitment ecosystem, although the direct effect of NIRF rank on hiring decisions is difficult to establish.
Student skills and programme-level performance → ultimately determine individual placement outcomes.
As per the NIRF methodology, multiple dimensions other than placement are used for ranking institutions, which include Teaching, Learning & Resources, Research and Professional Practice, Outreach and Inclusivity, and Perception. According to the Engineering framework, for instance, TLR & Research hold 30% weight each, while Graduation Outcomes have 20%.
So, you should view the NIRF rank as one indicator of the institutional performance rather than a placement guarantee.
What Does NIRF Data Say About LPU?
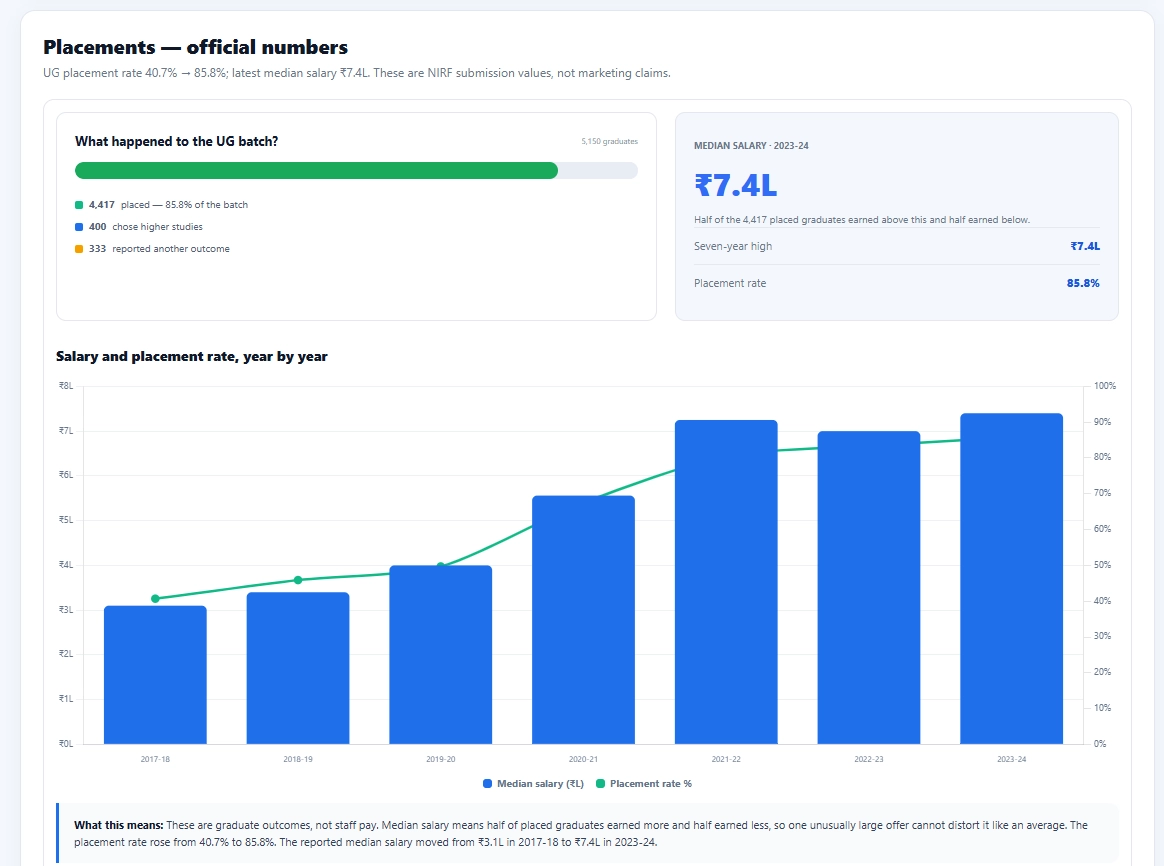
This is where the NIRF data becomes actually useful. Instead of just the highest-package figure, the NIRF submission provides us with standardized information about graduates, students placed, and the median salary. It is important to note that the NIRF ranking year and the placement data year are different. For example, the NIRF 2025 submission reports placement data for the 2023–24 graduating batch. The latest UG 4-year LPU placement figures that were reported through its NIRF submission show the following data.
NIRF Ranking Year | LPU University Rank | NIRF Score | Placement Data Year | Graduates | Students Placed | Placement Rate | Median Salary |
2025 | 31 | 57.77 | 2023-24 | 5,150 | 4,417 | 85.8% | ₹7.40 Lakh |
2024 | 27 | 56.92 | 2022-23 | 5,517 | 4,601 | 83.4% | ₹7.00 Lakh |
2023 | 38 | 52.30 | 2021-22 | 4,271 | 3,441 | 80.6% | ₹7.25 Lakh |
2022 | 47 | 48.92 | 2020-21 | 5,990 | 4,041 | 67.5% | ₹5.56 Lakh |
2021 | 62 | 43.33 | 2019-20 | 4,929 | 2,450 | 49.7% | ₹4.00 Lakh |
The above data shows us that the UG 4-year LPU placement rate has gone up from 49.7% in 2019-20 to 85.8% in 2023-24, whereas the median salary has risen from ₹4.00 lakh to ₹7.40 lakh during the same period. This would be more helpful in analyzing the overall picture regarding placement compared to the analysis of a particular extremely high package.
What Is Median Salary?
The median salary is not the highest or average package. In case the median salary is ₹7.40 lakh, then this indicates that half of the graduates who have been placed earn higher and the other half earn less than ₹7.40 lakh. Therefore, the median salary is considered beneficial in analyzing the placement result since an extreme package figure would not affect it.
LPU NIRF Rank Vs. Placement Growth
In this section, we are going to examine how changes in LPU's NIRF rank have coincided with changes in its placement outcomes.
Period | University Rank Change | Placement Rate Change | Median Salary Change | What Happened? |
2021 → 2022 | 62 → 47 ↑ 15 positions | 49.7% → 67.5% ↑ 17.8 pp | ₹4.00 L → ₹5.56 L ↑ ₹1.56 L | Rank, placement, and salary all improved. |
2022 → 2023 | 47 → 38 ↑ 9 positions | 67.5% → 80.6% ↑ 13.1 pp | ₹5.56 L → ₹7.25 L ↑ ₹1.69 L | Rank, placement, and salary all improved. |
2023 → 2024 | 38 → 27 ↑ 11 positions | 80.6% → 83.4% ↑ 2.8 pp | ₹7.25 L → ₹7.00 L ↓ ₹0.25 L | Rank and placement improved; salary declined. |
2024 → 2025 | 27 → 31 ↓ 4 positions | 83.4% → 85.8% ↑ 2.4 pp | ₹7.00 L → ₹7.40 L ↑ ₹0.40 L | Rank declined; placement and salary improved. |
2021 → 2025 | 62 → 31 ↑ 31 positions | 49.7% → 85.8% ↑ 36.1 pp | ₹4.00 L → ₹7.40 L ↑ ₹3.40 L | Strong long-term improvement in placement and salary, alongside a better NIRF rank. |
LPU Placement: What The University Reports
The NIRF data and the LPU placement reports serve different purposes. Currently, the placement report of LPU provides 2,225+ recruiters, 6,000+ offers, and the median salary of ₹10.23 lakh for the top 25% of placed students. Moreover, LPU points out salaries of ₹10 lakh to ₹2.5 crore for various packages.
LPU Placement Indicator | Figure Reported |
Recruiters | 2,225+ |
Offers from Fortune 500 companies | 6,000+ |
Recruiters that also recruit from IITs/IIMs/NITs | 400+ |
Average salary – top 25% placed students | ₹10.23 Lakh |
Average salary – top 10% placed students | ₹12.3 Lakh |
Package range highlighted by LPU | ₹10 Lakh – ₹2.5 Crore |
The published placement materials from LPU demonstrate numerous types of recruiters, which include technology companies, IT services companies, financial services firms, manufacturing firms, and so on. The placement section of the website also gives the example of B.Tech CSE placements with companies like Microsoft, Juspay, SAP Labs, among others.
All these numbers are important to understand the existing recruitment environment and placement opportunities; however, they cannot be compared with the median salary presented in NIRF.
Why Can LPU Placement Numbers Differ From NIRF Numbers?
Yes. The figures can differ because they measure different aspects of placement outcomes. The NIRF report measures standardized data about graduate placements of defined graduating batches. The LPU placement reports can reveal:
Highest packages
Number of offers
Recruiters
Top-performing students
Top 10% or top 25% salary figures
Individual placement achievements
Current recruitment activity
Thus, it is not inconsistent to have a ₹2.5 crore highest package and a ₹7.40 lakh NIRF median salary figure. They answer completely different questions.
The highest package will give you an idea about the upper limit. Median salary will provide some insight into the middle of the placed batch. For a prospective student, both numbers are important – but they should never be treated as one.
LPU B.Tech Placement: What Does NIRF Ranking Mean for Engineering Students?
If you are searching for the LPU B.Tech placement, then the NIRF Engineering ranking would be the most relevant ranking that you should consider.
In the NIRF 2025 rankings, LPU ranks 48 in Engineering with an overall score of 55.99. Its recruitment data indicates that the university has a large recruiter ecosystem across technology, consulting, finance, manufacturing, etc. According to its current placement page, LPU works with companies like Google, Microsoft, Amazon, Cisco, TCS, Cognizant, Capgemini, Infosys, PwC, JPMorgan Chase, EY, Bosch, and many more.
NIRF Engineering Rank Vs. LPU B.Tech Placement Outcomes
NIRF Ranking Year | LPU Engineering Rank | NIRF Score | Placement Batch | Graduates | Students Placed | Placement Rate | Median Salary |
2025 | 48 | 55.99 | 2023-24 | 3,891 | 2,754 | 70.8% | ₹8.00 Lakh |
2024 | 50 | 54.16 | 2022-23 | 4,099 | 3,508 | 85.6% | ₹6.50 Lakh |
2023 | 50 | 51.47 | 2021-22 | 3,543 | 2,435 | 68.7% | ₹7.07 Lakh |
2022 | 51 | 49.48 | 2020-21 | 5,165 | 2,401 | 46.5% | ₹4.50 Lakh |
2021 | 66 | 43.69 | 2019-20 | 3,936 | 1,606 | 40.8% | ₹4.00 Lakh |
LPU B.Tech NIRF Rank Vs. Placement Growth
Period | Engineering Rank Change | Placement Rate Change | Median Salary Change | What Happened? |
2021 → 2022 | 66 → 51 ↑ 15 positions | 40.8% → 46.5% ↑ 5.7 pp | ₹4.00 L → ₹4.50 L ↑ ₹0.50 L | Rank, placement, and salary all improved. |
2022 → 2023 | 51 → 50 ↑ 1 position | 46.5% → 68.7% ↑ 22.2 pp | ₹4.50 L → ₹7.07 L ↑ ₹2.57 L | All three measures improved. |
2023 → 2024 | 50 → 50 No change | 68.7% → 85.6% ↑ 16.9 pp | ₹7.07 L → ₹6.50 L ↓ ₹0.57 L | Placement improved; salary declined. |
2024 → 2025 | 50 → 48 ↑ 2 positions | 85.6% → 70.8% ↓ 14.8 pp | ₹6.50 L → ₹8.00 L ↑ ₹1.50 L | Rank and salary improved; placement rate declined. |
2021 → 2025 | 66 → 48 ↑ 18 positions | 40.8% → 70.8% ↑ 30.0 pp | ₹4.00 L → ₹8.00 L ↑ ₹4.00 L | Strong long-term improvement, but not a year-to-year match. |
However, for an engineering student, the NIRF Engineering ranking would just be the first step. Actual chances of placement depend on:
Engineering branch
CGPA
Technical skills
Programming ability
Internships
Projects
Certifications
Aptitude and communication skills
Interview performance
Recruiter eligibility criteria
That is the reason why two engineering students in the same college can have drastically different results.
LPU B.Tech CSE Placement
Among the various engineering courses offered at LPU, CSE and other computing sciences have an especially expansive technology recruiter ecosystem. The recruitment page currently includes several examples of successful LPU B.Tech CSE placement at firms like Microsoft, Juspay, SAP Labs, and other technology recruiters. Some recent examples given by the university include a package of ₹53.41 lakh at Microsoft, ₹27 lakh at Juspay, and ₹20.75 lakh at SAP Labs for individual students.
This shows that when choosing LPU B.Tech CSE placement, there is a good chance of access to many technology recruiters.
Yet the student must understand that individual package figures are no guarantee of an equally well-paid job for all CSE graduates. The CSE placement results are strongly contingent on the technical portfolio of the student. Specifically, the student aspiring for software and product company placement should concentrate on:
Data structures and algorithms
Programming languages
Software development
Database management
Projects and GitHub work
Internships
Problem-solving
Technical interview preparation
Artificial intelligence, data science, and cybersecurity specializations are also valuable in developing technological niches, but their worth will be proportional to the student's skills and experience.
LPU MBA Placement
Management NIRF Ranking has more relevance for students pursuing their MBA than the Engineering ranking. In the 2025 NIRF, LPU's position in Management was 44, scoring 55.00.
NIRF Management Rank Vs. LPU MBA Placement Outcomes
NIRF Ranking Year | LPU Management Rank | NIRF Score | Placement Batch | Graduates | Students Placed | Placement Rate | Median Salary |
2025 | 44 | 55.00 | 2023-24 | 625 | 261 | 41.8% | ₹6.77 Lakh |
2024 | 38 | 55.49 | 2022-23 | 412 | 384 | 93.2% | ₹8.50 Lakh |
2023 | 32 | 56.44 | 2021-22 | 482 | 126 | 26.1% | ₹6.00 Lakh |
2022 | 34 | 54.30 | 2020-21 | 592 | 402 | 67.9% | ₹6.15 Lakh |
2021 | 37 | 51.85 | 2019-20 | 570 | 340 | 59.6% | ₹5.20 Lakh |
LPU MBA NIRF Rank Vs. Placement Growth
Period | Management Rank Change | Placement Rate Change | Median Salary Change | What Happened? |
2021 → 2022 | 37 → 34 ↑ 3 positions | 59.6% → 67.9% ↑ 8.3 pp | ₹5.20 L → ₹6.15 L ↑ ₹0.95 L | Rank, placement, and salary all improved. |
2022 → 2023 | 34 → 32 ↑ 2 positions | 67.9% → 26.1% ↓ 41.8 pp | ₹6.15 L → ₹6.00 L ↓ ₹0.15 L | Rank improved, but placement and salary declined. |
2023 → 2024 | 32 → 38 ↓ 6 positions | 26.1% → 93.2% ↑ 67.1 pp | ₹6.00 L → ₹8.50 L ↑ ₹2.50 L | Rank declined, while placement and salary increased. |
2024 → 2025 | 38 → 44 ↓ 6 positions | 93.2% → 41.8% ↓ 51.4 pp | ₹8.50 L → ₹6.77 L ↓ ₹1.73 L | Rank, placement, and salary all declined. |
2021 → 2025 | 37 → 44 ↓ 7 positions | 59.6% → 41.8% ↓ 17.8 pp | ₹5.20 L → ₹6.77 L ↑ ₹1.57 L | Score and salary rose long-term, but rank and placement rate did not. |
Moreover, it can be observed that the LPU MBA placement percentages exhibit much more variation from one year to another when compared to the UG 4-year placement percentages. This variation may reflect differences between graduating batches and recruitment conditions from one year to another. Hence, MBA aspirants must not draw conclusions based on a single year’s percentage.
However, the highest package should not be the only criterion for an MBA aspirant. A more objective assessment could be made on the basis of:
Median and average salary
Number and quality of recruiters
Job functions
Internship opportunities
Industry exposure
Alumni outcomes
Sector diversity
Career progression
NIRF Management Ranking helps assess the institution, whereas LPU MBA placement details help understand the career prospects of the program.